What options flow actually is
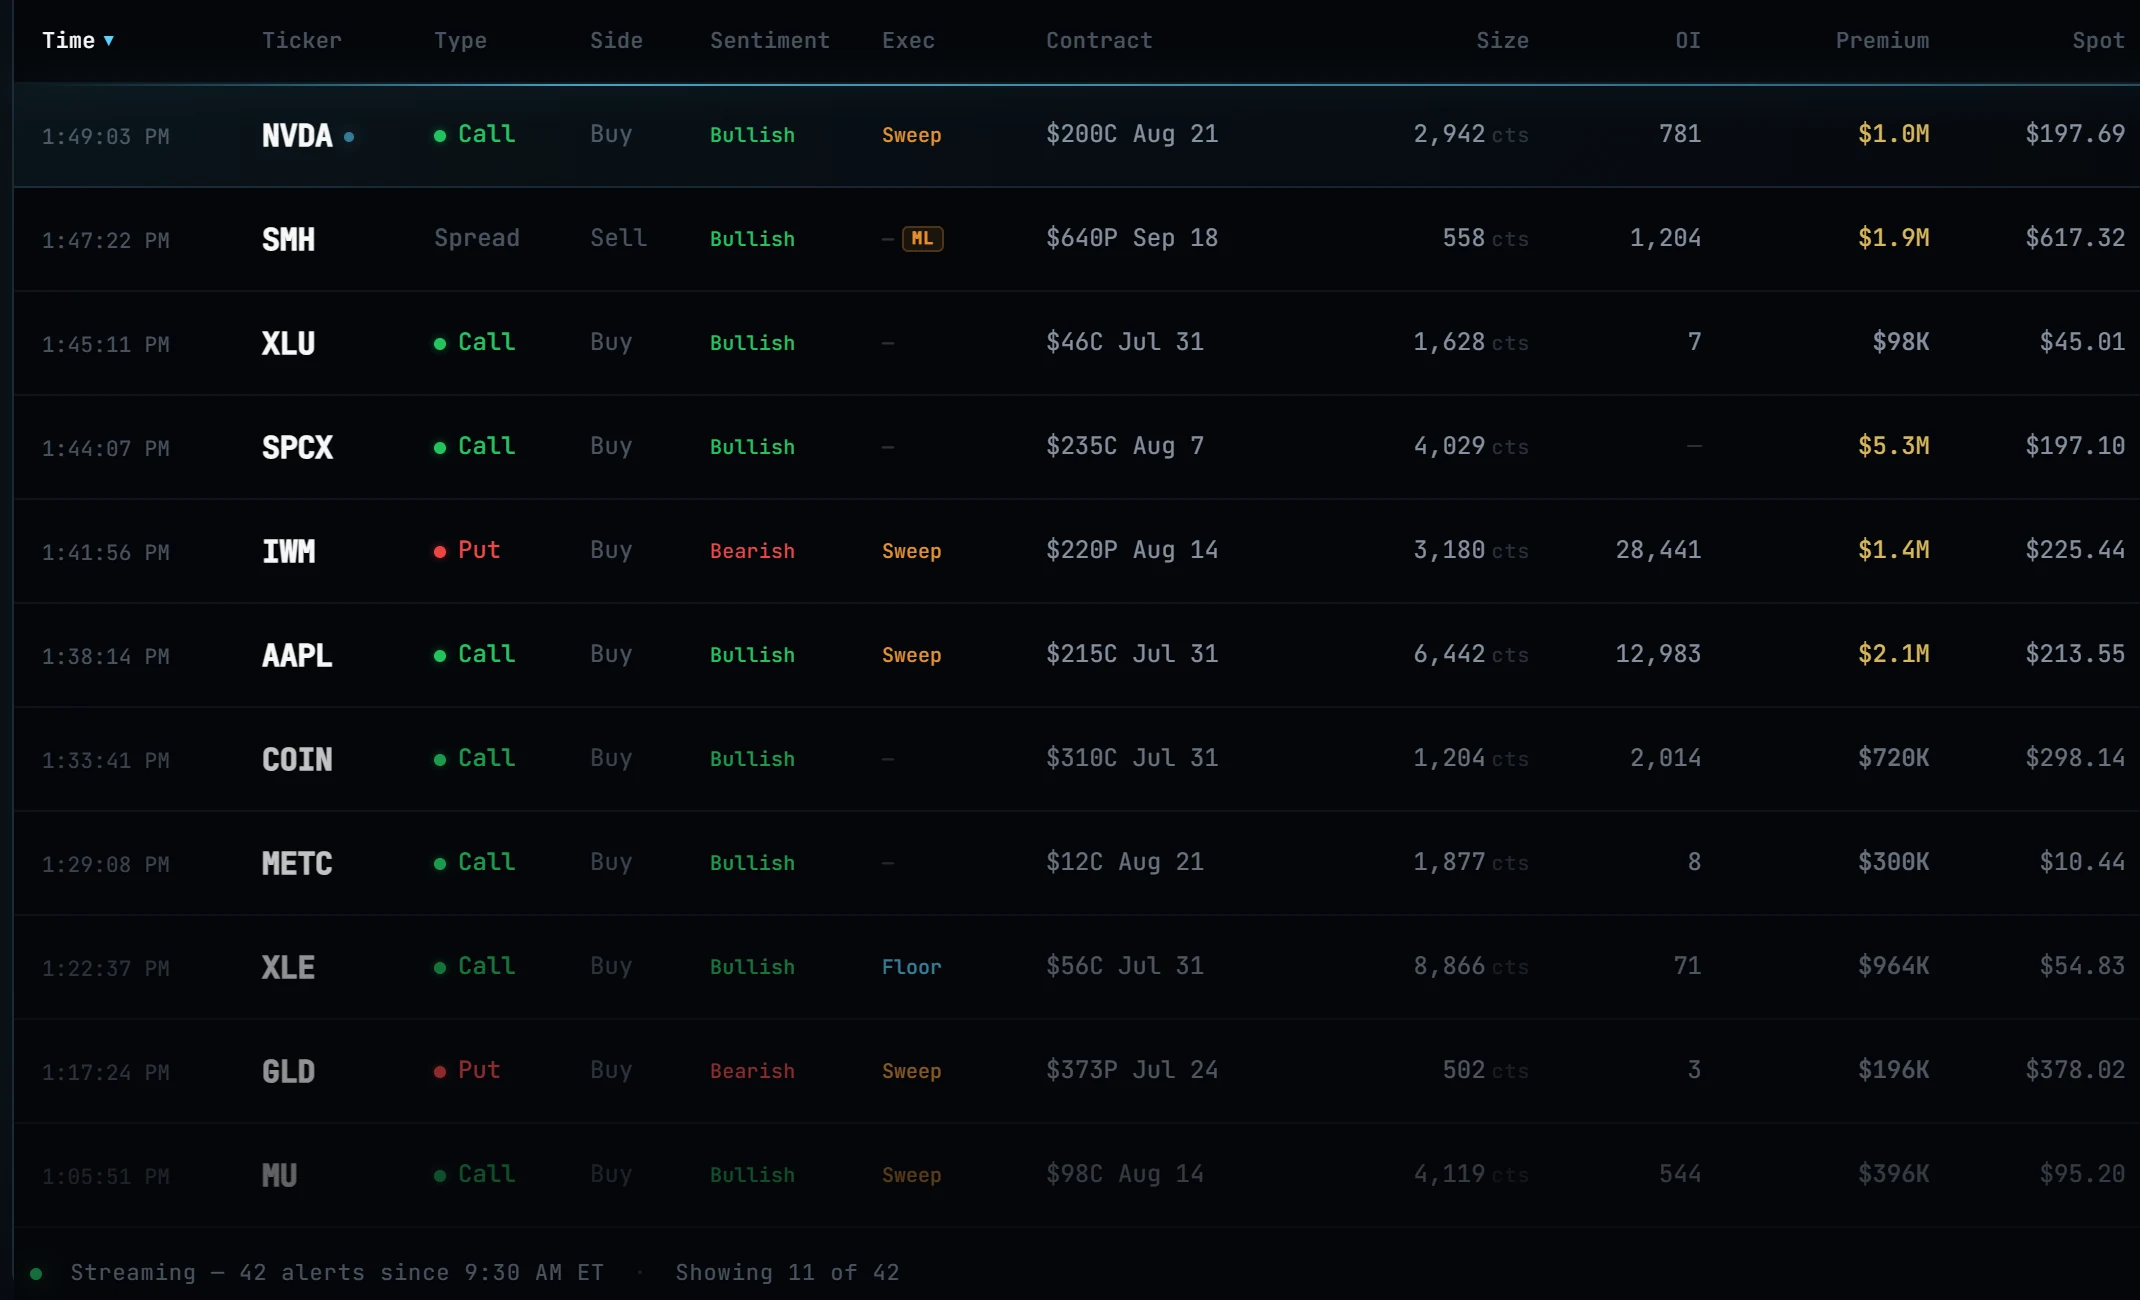
Options flow is the live record of options trades as they execute on US exchanges. Every listed contract that changes hands prints to a public tape with a timestamp, a size, and a price. Flow is what you get when you watch that tape in real time and pay attention to the trades that stand out: unusually large premium, aggressive fills, sudden interest in a strike that normally trades a handful of contracts a day.
The raw tape is enormous. Tens of millions of contracts trade on a normal session, and the overwhelming majority are routine: market makers laying off risk, funds rolling hedges, small retail lots. A flow tool is a filter over that stream. It scans everything and surfaces the small fraction of prints that suggest someone with real size just took a position, so you can decide whether the trade behind the print is worth understanding.
Where the data comes from
Every listed US options trade is reported through OPRA, the Options Price Reporting Authority, which consolidates trade and quote data from all of the US options exchanges into a single feed. That feed is the source of truth for every flow product on the market. The prints themselves are the same for everyone; what institutional money buys is mostly speed, since direct per-exchange feeds deliver the same data faster than the consolidated tape does.
What the tape reports for each trade:
- Symbol, expiration, strike, and whether it is a call or a put
- Execution price and size
- The exchange it printed on and a timestamp
- Condition codes describing how the trade executed
What it does not report: who traded it, whether the trade opened a new position or closed an old one, and why they did it. Everything else you see in a flow tool, buyer versus seller, opening versus closing, bullish versus bearish, is inference layered on top of those raw fields. The data is public and identical everywhere; tools differ in the interpretation they layer on top, and that layer is where mistakes get made.
Reading a single print
A flow alert compresses several inferences into one line. It helps to know what each piece actually means and how firm the ground under it is.
| Element | What it is | How firm the read is |
|---|---|---|
| Premium | Contracts times price times 100 for standard contracts. A 2,000-lot at $3.50 is $700,000 committed. | Hard fact from the tape. |
| Side (bought or sold) | Inferred by comparing the fill to the bid and ask at execution. Near the ask suggests an aggressive buyer, near the bid a seller. | Inference. Mid-market fills are genuinely ambiguous. |
| Sweep | One order routed to several exchanges near-simultaneously to take all available liquidity at once. | Hard fact that it swept; the urgency read is interpretation. |
| Block | A single large print, typically negotiated off the public book and then reported to an exchange. | Hard fact. Signals size, not necessarily urgency. |
| Volume vs. open interest | If today's volume in a contract exceeds the open interest it came in with, some of that volume must be new positions. | Solid logic, confirmed only when OI updates the next morning. |
The side inference is useful, but it has real limits. On a clean single-leg order in a liquid name, fill-versus-quote comparison works well. On complex orders, thin markets, or negotiated trades, the per-leg tag can point the wrong way entirely. Premium and size come straight off the tape. The side tag is an inference, and you should hold it loosely.
Why traders watch it
There are two honest reasons. The first is that options are levered and dated. Premium spent expresses both conviction and a timeline, because the position expires. Someone paying $700,000 for calls that die in three weeks either believes something specific about that window or is hedging something specific in it. Either way, the print tells you that a well-capitalized trader considers that particular window important enough to pay for.
The second reason is mechanical. The market maker on the other side of a large options trade typically hedges with stock, and when positioning concentrates at certain strikes, that dealer hedging can dampen or amplify moves in the underlying. This is why traders track dealer positioning and gamma exposure levels alongside the raw prints: the prints show where positioning is building, and dealer-hedging estimates give a rough sense of how the underlying could behave around those strikes.
There is also academic evidence that informed trading shows up in options ahead of some corporate events, takeovers being the best-documented case. That research supports watching flow around catalysts. It does not support the idea that every large print carries information, which brings us to the limits.
What flow can and cannot tell you
What the tape can establish: someone committed size, they did it with or without urgency, interest in a strike or a name has changed character, and positioning is concentrating somewhere it was not before. All of these are useful things to know before you take a trade.
What it cannot establish is intent. A large call purchase might be any of the following:
- A directional bet on the stock going up
- A hedge against a short stock position
- One leg of a spread whose other leg changes the meaning entirely
- A buy-to-close on calls sold weeks ago
- A roll from one expiration to another
Direction is slippery in a second way: selling puts is frequently a bullish trade, and buying puts against a long stock position is not a bearish one. The tape shows you the print but not the rest of the trader's book, so those cases are indistinguishable from outright directional bets.
You should also know that the predictive value of unusual options activity, taken as a broad category, is contested. The informed-trading evidence is strongest around discrete events; blanket follow-the-big-print strategies tend to look far better in screenshots than in honest accounting, because people circulate their winning examples and rarely mention the losing ones. Flow narrows your attention to trades worth investigating, and any position you then take still needs a thesis and a risk plan of its own.
The multi-leg problem
Most flow tools display legs, and this is where the worst misreads happen. Say a trader buys 5,000 of the 100-strike calls and sells 5,000 of the 110-strike calls in a single order. That is a call spread, a defined-risk structure that pays off on a moderate move higher. On a leg-by-leg feed it appears as a large bullish call sweep and, separately, a large bearish call sale, and plenty of readers will trade the first line without ever connecting it to the second.
The same failure applies to collars, risk reversals, calendar rolls, and stock-tied trades. A single leg viewed alone often points the wrong way; the structure carries the actual information. This is why whole-structure handling matters in any flow tool you use. When you evaluate any feed, the first question worth asking is what it does with the second leg.
Using flow without fooling yourself
A workable process looks something like this:
- Treat alerts as candidates, not signals. A print justifies research, not an automatic entry.
- Check the calendar first. Earnings, FDA dates, product events. A large print placed ahead of a scheduled catalyst is easier to interpret than one placed into a quiet calendar.
- Confirm with open interest. If the thesis is new positioning, next morning's OI change either supports it or kills it.
- Assume the hedge case. Size your trade as if the buyer might be hedging rather than speculating, because often they are.
- Score everything you act on. Record winners and losers alike, measured against a yardstick you fixed before entering the trade, so the results cannot be edited by memory afterward.
That last point is the standard worth holding any flow tool to as well. Nightglass publishes its full track record, where every signal is scored against the same fixed yardstick, a +30% gain before a −50% drawdown on first passage from the alerted fill, scored at contract expiry, with SPY and index trades listed apart, losers included, and peak gains labeled as peak rather than returns. You can read it at /performance and judge the accounting for yourself.
Questions traders ask
Is options flow the same as dark pool data?
No. Dark pool prints are off-exchange equity trades reported through the trade reporting facilities. Listed options have no equivalent dark venue; every listed US options trade must print to a lit exchange and gets consolidated by OPRA. Large negotiated options trades show up on the tape as blocks rather than disappearing into a dark pool.
Can you tell whether an options trade is opening or closing?
Not directly. The tape does not carry an opening or closing flag. The standard inference is volume versus open interest: if a contract trades more volume today than the open interest it started with, some of that volume must be new positions. The next morning's open interest update is the real confirmation, since OI rising means net new positions were opened.
Does unusual options activity actually predict stock moves?
It is contested. Academic research finds evidence of informed options trading ahead of discrete events, takeover announcements especially. But most large prints are hedges, rolls, or spread legs, and broad strategies that blindly follow big prints tend not to survive honest accounting. Flow works better as a way to decide what to investigate than as a list of trades to copy.
What makes a trade count as unusual?
Size relative to that specific contract's normal behavior. A 500-lot in a contract that trades 50 contracts a day is unusual; the same 500-lot in a major index product is background noise. Common screens include volume well above open interest, premium large for the name, aggressive execution such as sweeps at the ask, and short-dated out-of-the-money strikes that only pay if something happens soon.
Do I need flow data to trade options?
No. Plenty of options strategies never reference the tape. Flow adds context about where size is positioning and where dealer hedging pressure sits, which is most useful for traders who trade directionally around catalysts and levels. If you do use it, the quality of the interpretation, especially multi-leg handling and honest scoring, matters more than the raw feed, which is the same everywhere.
Everything Nightglass surfaces is scored on a public track record — winners and losers, methodology included. See the tape →