1. Calling every put bearish and every call bullish
Start with the error that costs the most. A trader sees 30,000 puts trade on a name, marks the tape bearish, and sizes a position off it. Roughly half the time that read is backwards, because every option that trades has a buyer and a seller, and the signal depends on which one initiated.
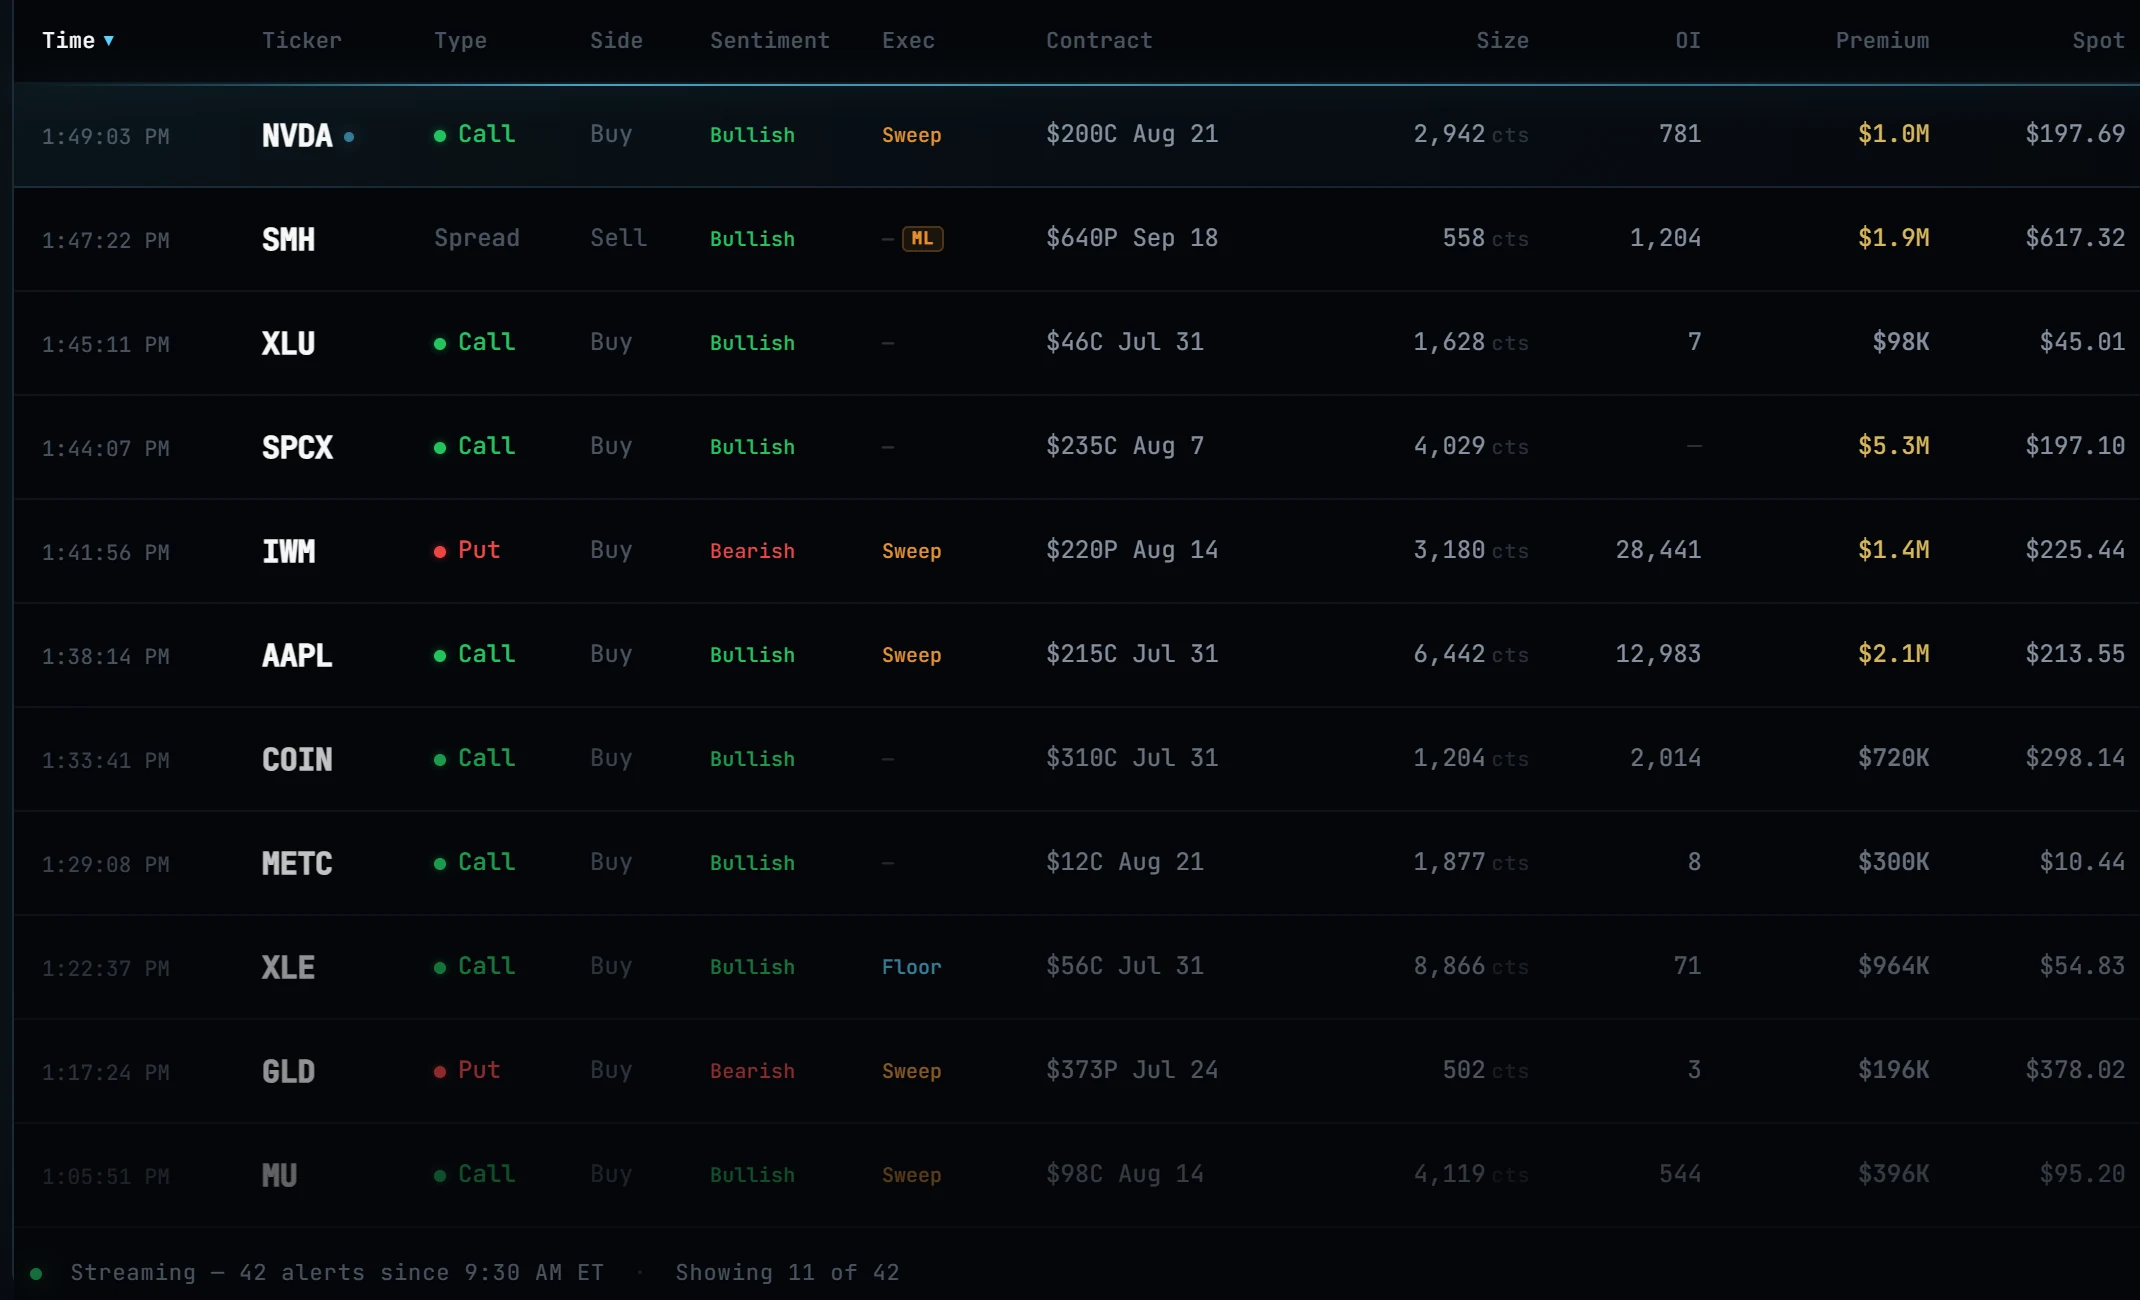
The habit is understandable. Chains and alert feeds show contract type and size, puts have a bearish reputation, and nothing on the screen says who crossed the spread. That missing detail is the whole signal. A fill at the ask means the buyer initiated and paid up to get the contract. When volume prints at the bid instead, the seller drove the trade and accepted the lower price to get it done. Selling a put is a commitment to buy stock at the strike, which is a bullish act: the seller collects premium today and agrees to own shares at a lower price. Selling a call caps the upside on stock the seller usually already owns.
Classifying each print by option type and initiating side gives you four possible reads:
| Contract | Dominant fills | Who initiated | Read |
|---|---|---|---|
| Calls | At the ask | Buyer | Bullish |
| Calls | At the bid | Seller | Bearish to neutral, often income |
| Puts | At the ask | Buyer | Bearish, or a hedge on a long book |
| Puts | At the bid | Seller | Bullish |
A hypothetical: a stock trades at $80 and 30,000 of the $75 puts change hands during the session, the bulk of them at the bid. That is most likely an institution writing puts, getting paid to promise a purchase five dollars lower. A feed will report heavy put activity. The position behind it is a bet that the stock holds up.
One caution. Side classification is an inference from quote data, not ground truth. Midpoint fills are ambiguous and platforms can tag the same print differently, so look for a clear majority on one side rather than calling direction off a near-even split.
2. Using the put/call ratio to pick a direction
The put/call ratio survives because it compresses a full day of options activity into one number that fits in a headline. That compression is exactly what breaks it as a direction tool. The ratio counts put volume against call volume and carries no information about which side initiated any of it.
Traders reach for it because it is quoted everywhere and feels like a sentiment gauge. But heavy put volume can be funds buying protection, or funds writing puts to get paid for standing under the market, and those two flows point in opposite directions. The ratio scores them identically.
The correct use is narrow. A ratio far outside its usual range tells you attention has shifted toward one side of the chain, and that is worth a look. Direction has to come from classification: how much of the put volume printed at the ask versus the bid, and the same for calls. Without that step, the ratio only measures activity.
A hypothetical: a name prints a put/call ratio near 3 the day after a selloff, and the commentary calls it fear. Classified, most of that put volume sat on the bid. Institutions were selling puts, collecting elevated premium and volunteering to buy the dip. The same ratio supported the opposite conclusion.
3. Treating every sweep alert as a signal
A sweep is an order split across several exchanges at once so it fills immediately at whatever prices are showing. It tells you the trader valued speed over price. That is genuine information about urgency, and it is the only thing a sweep tells you by itself.
Sweep alerts became retail shorthand for smart money because they look dramatic and arrive with large premium figures attached. Feeds surface enormous numbers of them every day, which is the first problem: an event that fires that often is not selecting for much.
Before a sweep means anything, it has to pass the same checks as any other print:
- Which side initiated, and how much of the volume was clean single-leg flow rather than pieces of a package.
- Where the strike and expiry sit. A far out-of-the-money weekly sweep is often a lottery ticket, or the short leg of a structure.
- Whether the volume became a position. Open interest updates overnight, and a heavily traded contract showing almost no open-interest change the next morning was day-trade churn that closed before the bell.
A hypothetical: an alert flags a $9 million call sweep on a mid-cap, 40,000 contracts at the ask. The next morning, open interest on that line is up by about 1,000. Almost none of the session's volume was held overnight. The print that looked like conviction was churn.
4. Reading one leg of a spread as a standalone bet
Institutions rarely buy or sell a single option. They trade structures such as verticals, collars, risk reversals, and calendar rolls, which express a defined-risk view through two or more contracts at once. The exchange executes the package as one order, but most data feeds break it back into individual legs, and each leg then looks like a standalone trade.
The misread happens because nothing on most screens marks a leg as part of a package. A block of calls sold at the bid looks like a bearish bet even when it is the financing leg of a spread whose owner is outright bullish.
Two habits fix most of this. First, check what share of the contract's volume traded as multi-leg. When the bulk of it did, direction inferred from any single leg is a guess, and the honest read is structured flow with uncertain direction. Second, scan for a sibling: same ticker and expiry, similar size, nearby strike, printed around the same time. If you find one, you are looking at one trade, not two opinions.
A hypothetical: 12,000 of a stock's $105 calls print at the ask while 12,000 of the $115 calls print at the bid, same expiry, inside the same minute. That is one trader buying a call spread, bullish up to $115 and capped there. Read the $115 line on its own and you log institutional call selling that never existed. The largest index and mega-cap products are the worst offenders, since hedging programs and spread books push most of their volume through packages.
5. Quoting gross premium on spreads
Once you can spot a spread, the next error is sizing it wrong. Feeds and social posts tend to report gross premium, usually the biggest leg or the sum of both legs, because the bigger number travels better. The risk on a debit spread is the net debit: what was paid for the long leg minus what was collected on the short leg.
A hypothetical with round numbers: a trader buys 10,000 call spreads, paying $3.00 for the lower strike and collecting $1.40 for the upper. A headline will call it $3 million in call buying, or $4.4 million if both legs get counted. The capital actually at risk is $1.60 per spread, $1.6 million in total, roughly half the smaller headline. Overstating size by that much changes how the trade ranks against everything else on the tape that day.
Dollar premium misleads in a second way: option prices scale with implied volatility. A given spend on calls in a name running hot into earnings buys far fewer contracts than the same spend in a quiet name, so ranking prints by dollars systematically flatters expensive, high-volatility tickers. Contract count and aggression at the ask say more about conviction than the dollar figure does. Use premium as a floor to screen out noise, not as a measure of quality.
6. Assuming the other side of the trade has an opinion
When a fund buys 20,000 calls, someone sold them 20,000 calls, and the instinct is to picture an equally informed bear on the other side. Usually there is no bear. The counterparty on most institutional size is a market maker whose business is quoting two-sided prices, and who neutralizes the new exposure within seconds by trading shares against the option's delta.
The instinct carries over from stock trading, where a large print does require a willing opinion on both sides at that price. An options dealer's book does not work that way. It is a hedged inventory rather than a portfolio of views, and the hedge is mechanical: the dealer who sold the calls buys stock in proportion to the option's delta, then keeps adjusting as the stock moves.
This changes two reads. The sell side of a large print is not a fade, so there is no signal in the bare fact that someone took the other side. And even the initiating side is only a footprint. A large put purchase might be a directional short, or it might be insurance on a long book ten times its size. You can see what traded and who pushed the order; motive is an inference to hold loosely.
A hypothetical: a fund lifts 15,000 calls from a dealer at the ask. The dealer immediately buys shares to flatten the delta and keeps rebalancing that hedge for the life of the position. Nothing in the transaction contains a bearish opinion, and treating the dealer's short calls as a smart-money fade means reading a hedging machine's bookkeeping as a view.
The common thread across all six mistakes is trusting a headline number before checking who initiated the trade and whether the volume ever became a position. Those checks are slow by hand, which is most of the reason they get skipped. If you want to see what the tape looks like once that work is done, our performance page keeps a running record.
Questions traders ask
Is a high put/call ratio bearish?
Not on its own. The ratio measures put volume relative to call volume and says nothing about who initiated the trades. Heavy put volume printed at the bid means puts were being sold, which is supportive rather than bearish. Use the ratio as an attention gauge and get direction from side classification.
Why is selling a put bullish?
The seller takes on an obligation to buy stock at the strike price and collects premium for accepting it. It works like a paid limit order below the market: the seller either keeps the premium while the stock holds up, or owns shares at a price they had already accepted. Both outcomes rely on the stock not falling apart, which makes the position bullish.
Do sweep orders mean institutions are buying?
A sweep only tells you the order was routed across multiple exchanges for speed. It signals urgency, not identity or quality. Retail orders can sweep, sweeps can be closing trades, and heavily swept contracts often show almost no open-interest change the next day. Check the initiating side and whether the volume became a position before reading anything into it.
How can I tell if a large print is one leg of a spread?
Check how much of the contract's volume traded as multi-leg, then scan the same ticker and expiry for a second strike of similar size printed around the same time. Matching size on nearby strikes, one at the ask and one at the bid, is almost always a single spread order. When most of the volume is package flow and no sibling is visible, treat the direction as uncertain rather than guessing.
Everything Nightglass surfaces is scored on a public track record — winners and losers, methodology included. See the tape →