What institutional options flow actually means
Institutional options flow is the slice of options volume traded by professional money: hedge funds, asset managers, pension overlay desks, bank desks hedging structured products, and market makers managing inventory. The phrase gets used loosely, but in practice it means trades large enough, measured in premium or contract count, that a retail account is an implausible explanation.
The reason traders care is structural. Options are levered and they expire. When a fund commits, say, $2 million of premium to calls expiring in five weeks, that position expresses a view, or offsets one, with a deadline attached. A fund can buy stock patiently for months without showing its hand, but an options position carries a strike and an expiry, which makes it unusually legible compared with almost anything else an institution does.
That visibility has limits. The tape will nearly always show you that size traded, and it will usually let you infer which side initiated. What it rarely tells you on its own is why the trade exists. Reading flow well means working with both of those facts at the same time, and the rest of this page covers each in turn: how size reaches the tape, and how much meaning you can responsibly pull from it.
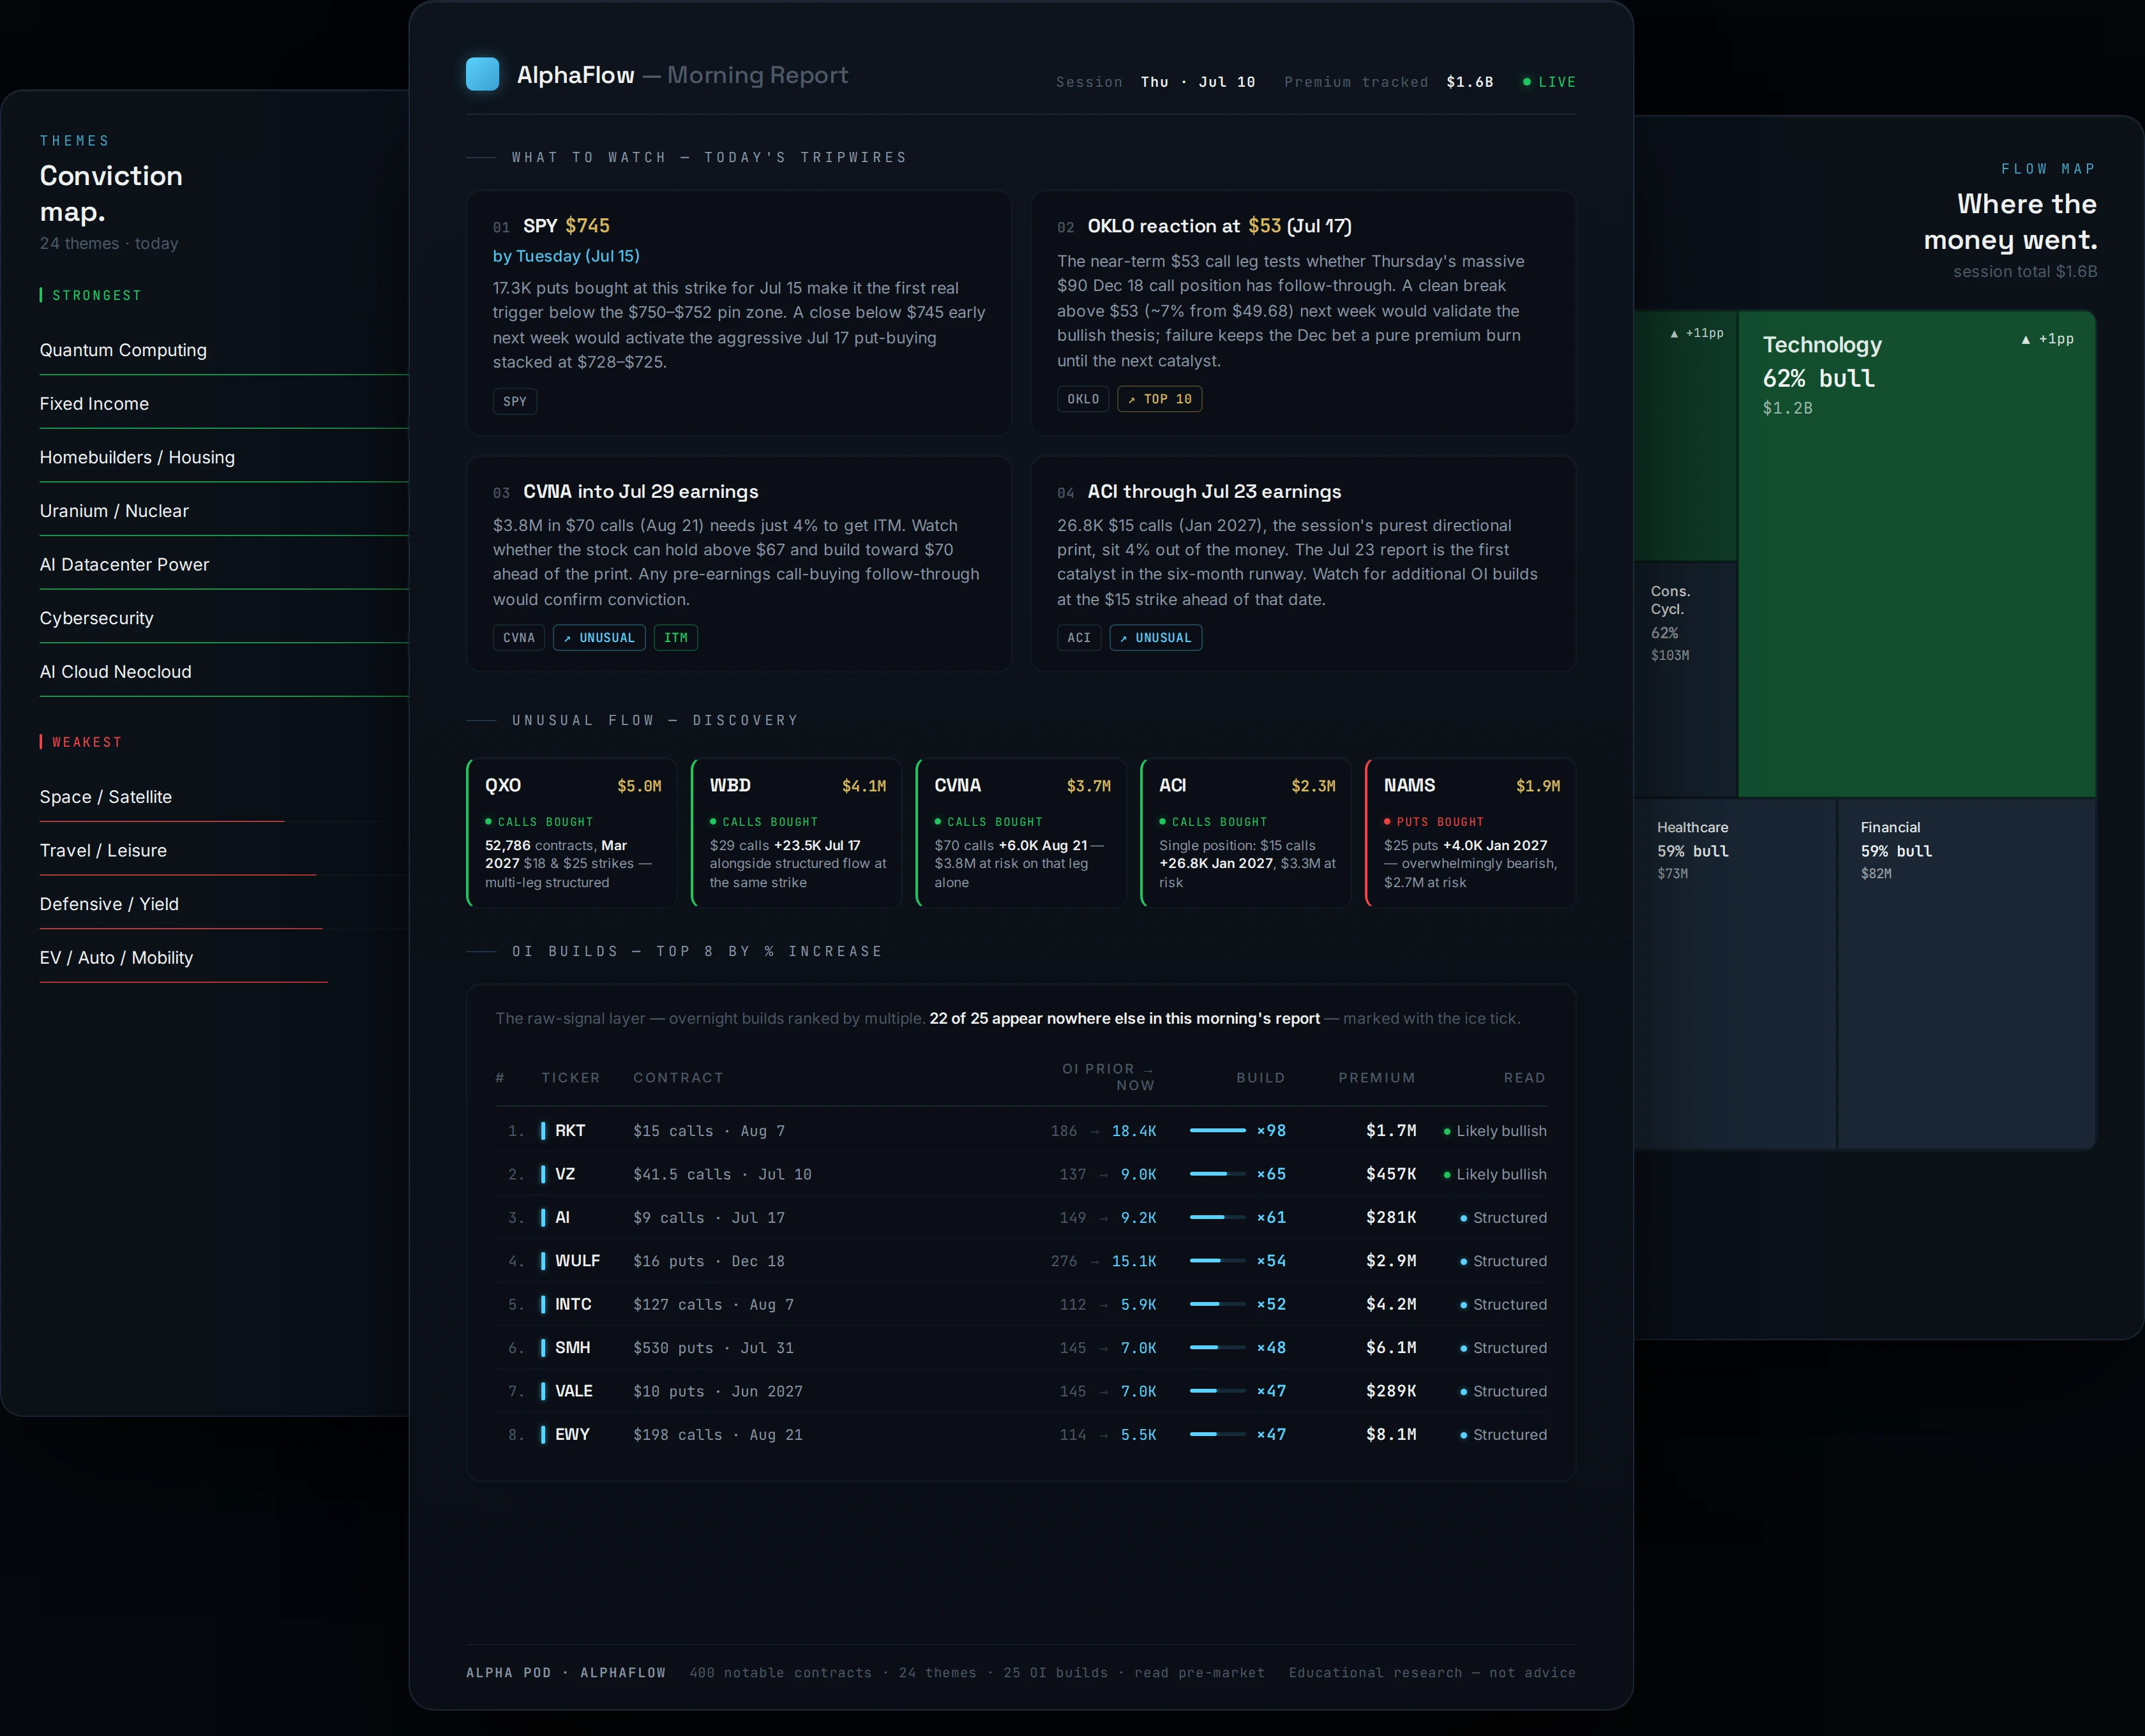
How large orders reach the tape: sweeps, blocks, negotiated prints
Start with a fact most retail traders never hear: there are no dark pools in US listed options. Equity volume can execute off-exchange; listed options cannot. Every trade, however it was arranged, prints to OPRA, the consolidated options tape. What varies is not whether institutional trades appear but what shape they take when they do.
Sweeps
When a trader wants size filled immediately, the order gets split across multiple exchanges quoting the contract, taking displayed offers up to the trader's limit price. On the tape it appears as a burst of prints in the same contract within the same second, across venues, usually at or above the ask. That execution style means the trader paid up for speed instead of working the order quietly over hours, which is worth knowing on its own. It still does not tell you whether the buyer is opening a new position or closing a short one under pressure.
Blocks and negotiated crosses
A block is one large print, sometimes thousands or tens of thousands of contracts, usually negotiated privately between an institution and a dealer and then crossed on an exchange, because the rules require even pre-arranged trades to print. Blocks tend to execute at or inside the quoted market and look calm on the tape, since the price was agreed before the print occurred. They skew toward hedges, rolls, and structured trades, though plenty of directional conviction has also gone up as a block.
Multi-leg structures
A large share of institutional volume is spreads: collars, risk reversals, calendars, call spreads tied to stock. These print as multiple legs, sometimes flagged as parts of a complex order and sometimes not. A feed that reads each leg in isolation will happily report the put leg of a collar as bearish institutional put buying, which is roughly the opposite of what the whole position means. Leg-blind reporting is one of the largest sources of false signal in flow reading, and it is worth checking whether any tool you use stitches structures back together before labeling them.
Why institutions cannot fully hide
An institution that wants to build a listed options position quietly has limited moves. It can split the order into small clips, spread it over days, use multiple brokers, and route during busy tape. All of that reduces visibility per print, but none of it removes the footprints.
The first footprint is open interest. Volume resets to zero every session, but open interest carries over, so the next morning's OI tells you what actually stuck. If 8,000 contracts trade on a strike carrying 500 of open interest, and the next morning open interest reads 8,300, the day's volume was overwhelmingly opening. No amount of clever routing changes that number, and checking it only requires waiting for the next morning's update.
The second footprint is repetition. Split orders show up as the same strike and expiry absorbing premium day after day. A single $500,000 print is ambiguous. The same contract taking $80,000 of aggressive premium daily for two weeks, hypothetical numbers, is a pattern, and it keeps showing up no matter how the orders are clipped.
The third is the market's own reaction. Market makers who sell those calls hedge by buying stock, and sustained one-sided demand lifts implied volatility on the strikes being bought. Skew and IV shift even when the individual prints are small.
The honest caveat: institutions can hold genuinely private exposure through OTC derivatives negotiated bilaterally with banks, and those never touch the listed tape. Public flow shows listed activity, which is most of the picture but not all of it. Nobody reading the tape sees a fund's whole book.
Premium thresholds: what counts as big
There is no official cutoff where a trade becomes institutional. What exists is convention, and the conventions run roughly like this:
| Premium in one print | Conventional read |
|---|---|
| Under $25,000 | Below most filters; could be anyone |
| $25,000 to $100,000 | Worth a look; active retail or small professional |
| $100,000 to $1 million | Probably professional |
| Over $1 million | Institutional almost by definition |
Those bands are habits of the trade, not rules, and premium is the right yardstick rather than contract count. Ten thousand contracts of a nickel option is $50,000 of premium, an amount plenty of retail accounts spend on lottery tickets. Two hundred contracts of a deep in-the-money call trading at $60 is $1.2 million of premium and near-certainly professional.
Two cautions. Thresholds are gameable: a desk that knows the feeds flag six-figure prints can clip orders at $40,000 and stay under the fold, which is exactly why repetition matters more than any single print. And thresholds are coarse: a $2 million print can be a dull roll of an existing hedge, while a $60,000 opening sweep into a strike with no open interest, eight days before earnings, can be the most interesting print of the day. Treat the bands as a first-pass filter and nothing more; what a print actually means has to come from the context around it.
The hedge-or-bet problem
Here is the problem nobody selling flow data likes to lead with: a large put purchase is one print with at least five explanations. It might be insurance on a long stock book, one leg of a collar whose call side printed separately, a dealer managing inventory, a fund running a volatility trade, or an outright bearish bet. On the tape, all five look identical.
This ambiguity is not fully resolvable, and any tool or trader claiming to resolve it completely is overreaching. What honest flow reading does is stack context until some explanations become strained:
- Tied-to-stock prints. When an options print executes alongside a stock print of hedging-appropriate size, the options are usually part of a buy-write, collar, or delta-neutral package rather than a naked view.
- Strike and tenor selection. Far-dated, out-of-the-money index puts in size are what portfolio insurance looks like. Near-dated single-name calls opened aggressively before a scheduled catalyst are much harder to explain as hedging.
- Open interest context. Opening trades into near-empty strikes read differently from volume that matches existing open interest, which may be closing or rolling.
- Aggressor inference. A print at the ask suggests the buyer initiated; at the bid, the seller. This is standard practice and mostly reliable, but it degrades at midpoint executions and on complex orders, and it should be treated as evidence rather than fact.
Even with all of that, you end at probability, not certainty. A workable posture is to treat every large print as a hedge until the surrounding evidence makes that reading awkward. You will discard some real bets, and you will also avoid narrating meaning onto a great deal of routine risk management.
How retail traders actually track it
The raw tape is not a viable starting point. OPRA carries an enormous quote stream and millions of individual trade prints on a busy day, and no human reads it unfiltered.
The workflow that matters, whether you run it by hand or a tool runs it for you, looks like this: filter prints by premium so the tape becomes readable; compare each print to the quote at execution time to infer the aggressor; stitch simultaneous legs into structures so spreads are read whole; confirm opening versus closing in the next morning's open interest; then watch for repetition, because accumulation across days is stronger evidence than any single print.
You can do a surprising amount of this without paying anyone. Standard option chains show volume against open interest, which flags unusual activity in a name you already watch. Next-morning open interest is free everywhere. Time and sales on a single contract will show you sweeps in real time, provided you already know which contract to watch. What paid tools actually sell is coverage and speed: watching every listed contract at once and doing the classification as it happens. The typical feed stops there, at large print, likely bought, and leaves the interpretation, hedge versus bet and opening versus closing, to you.
What following institutional flow can and cannot do
What it can do is narrow attention. Out of thousands of listed names, flow points at the handful where professional money is committing premium today, and it tells you the strikes and dates they chose. It shows urgency, since sweeps reveal who paid for immediacy. It gives positioning context around earnings and other events, and it can surface accumulation you would never notice on a chart. Published academic research has also found that options order flow can carry information about future stock prices, particularly around news events.
What it cannot do is show you the rest of the trader's book, so every print carries the ambiguity described above. It cannot lend you the institution's balance sheet or time horizon. A fund can be early for months, average in, roll positions forward, and treat the entire premium as a rounding error against a core holding, none of which you can replicate in a retail account with the same trade. And it cannot fix execution. By the time a print alerts, the contract has often repriced, and chasing at worse fills with expiry running against you converts a decent signal into a bad trade.
The realistic use is as an input: a reason to look at a name and a map of where size is positioned. Anyone converting flow into signals owes you scoring discipline in return, meaning losers published next to winners, one consistent yardstick, and peak gains labeled as peaks rather than returns. That is the standard Nightglass holds its own signals to, every alert scored through contract expiry on the public track record, losses included, at /performance.
Questions traders ask
What premium size counts as institutional options flow?
There is no official definition. By convention, prints over roughly $100,000 in premium are treated as probably professional and prints over $1 million as institutional, since very few retail accounts put seven figures into one options trade. Institutions also split orders below common alert thresholds, so repeated premium into the same strike over days is often better evidence than any single large print.
Can you tell whether a big options print was bought or sold?
Usually, by comparing the print to the quote at execution: a fill at or above the ask suggests the buyer initiated, at or below the bid the seller. This inference is standard and mostly reliable, but it breaks down at midpoint executions and on multi-leg orders. Next-morning open interest tells you separately whether the volume was opening or closing, which is often the more useful fact.
Do institutions actually know something when they buy options?
Sometimes. Published academic research has found that options order flow can carry information about future stock prices, especially around news events. But a large share of institutional options volume is hedging, rolling, or inventory management with no directional view at all, and on the tape those trades look identical to informed bets. A single print is context for a trade you already have independent reasons to like, and a poor tip on its own.
Is options flow data real-time, and can trades hide in dark pools?
There are no dark pools in US listed options. Every trade prints to OPRA, the consolidated tape, essentially as it happens, though many free sources display it delayed. Open interest, which confirms opening versus closing, updates once per day the following morning regardless of what feed you use. Genuinely private exposure exists only in OTC derivatives, which never touch the listed tape.
Should I copy institutional options trades?
Copying fills directly is usually a losing plan. You enter after the contract has repriced, you cannot see the rest of the trader's book, and you do not share their horizon or their ability to average and roll. Flow works better as a filter. Use it to decide which names are worth researching and to see where size has positioned, then build any trade you take on your own thesis. Whatever signal source you follow, ask to see its losers scored the same way as its winners.
Everything Nightglass surfaces is scored on a public track record — winners and losers, methodology included. See the tape →