What a single print actually shows you
Every options trade that executes on a US exchange is reported to the tape, and a flow feed is that tape filtered and formatted. One line on the feed, one print, typically carries: the underlying ticker, the contract (strike, expiry, call or put), the number of contracts, the fill price, the total premium (contracts × fill price × 100 on standard contracts; adjusted contracts can carry a different multiplier), the exchange it printed on, the bid and ask at the moment of the trade, the day's volume in that contract, the open interest coming into the day, and sometimes condition codes that flag how the order was handled.
None of those fields is a signal on its own. The information lives in the relationships between them: fill price relative to the quote, volume relative to open interest, size relative to what normally trades in that name. Reading flow well means running those comparisons quickly and knowing which ones are unreliable.
Premium is the field beginners fixate on first, so it helps to have rough tiers in mind. These are conventions, not rules, and the right thresholds shift with the liquidity of the underlying:
| Premium | Typical read | Caveat |
|---|---|---|
| Under $50k | Mostly retail-sized, high noise | Occasionally the opening clip of something larger |
| $50k–$250k | Serious retail or a small fund | Common size for spread legs |
| $250k–$1M | Institutional-sized | Frequently hedged or part of a package |
| Over $1M | Almost certainly a desk or institution | Very often tied to stock or other legs |
Notice the pattern in the caveats. The bigger the premium, the more likely the trade is something other than a naked directional bet, which is the opposite of how most people read it.
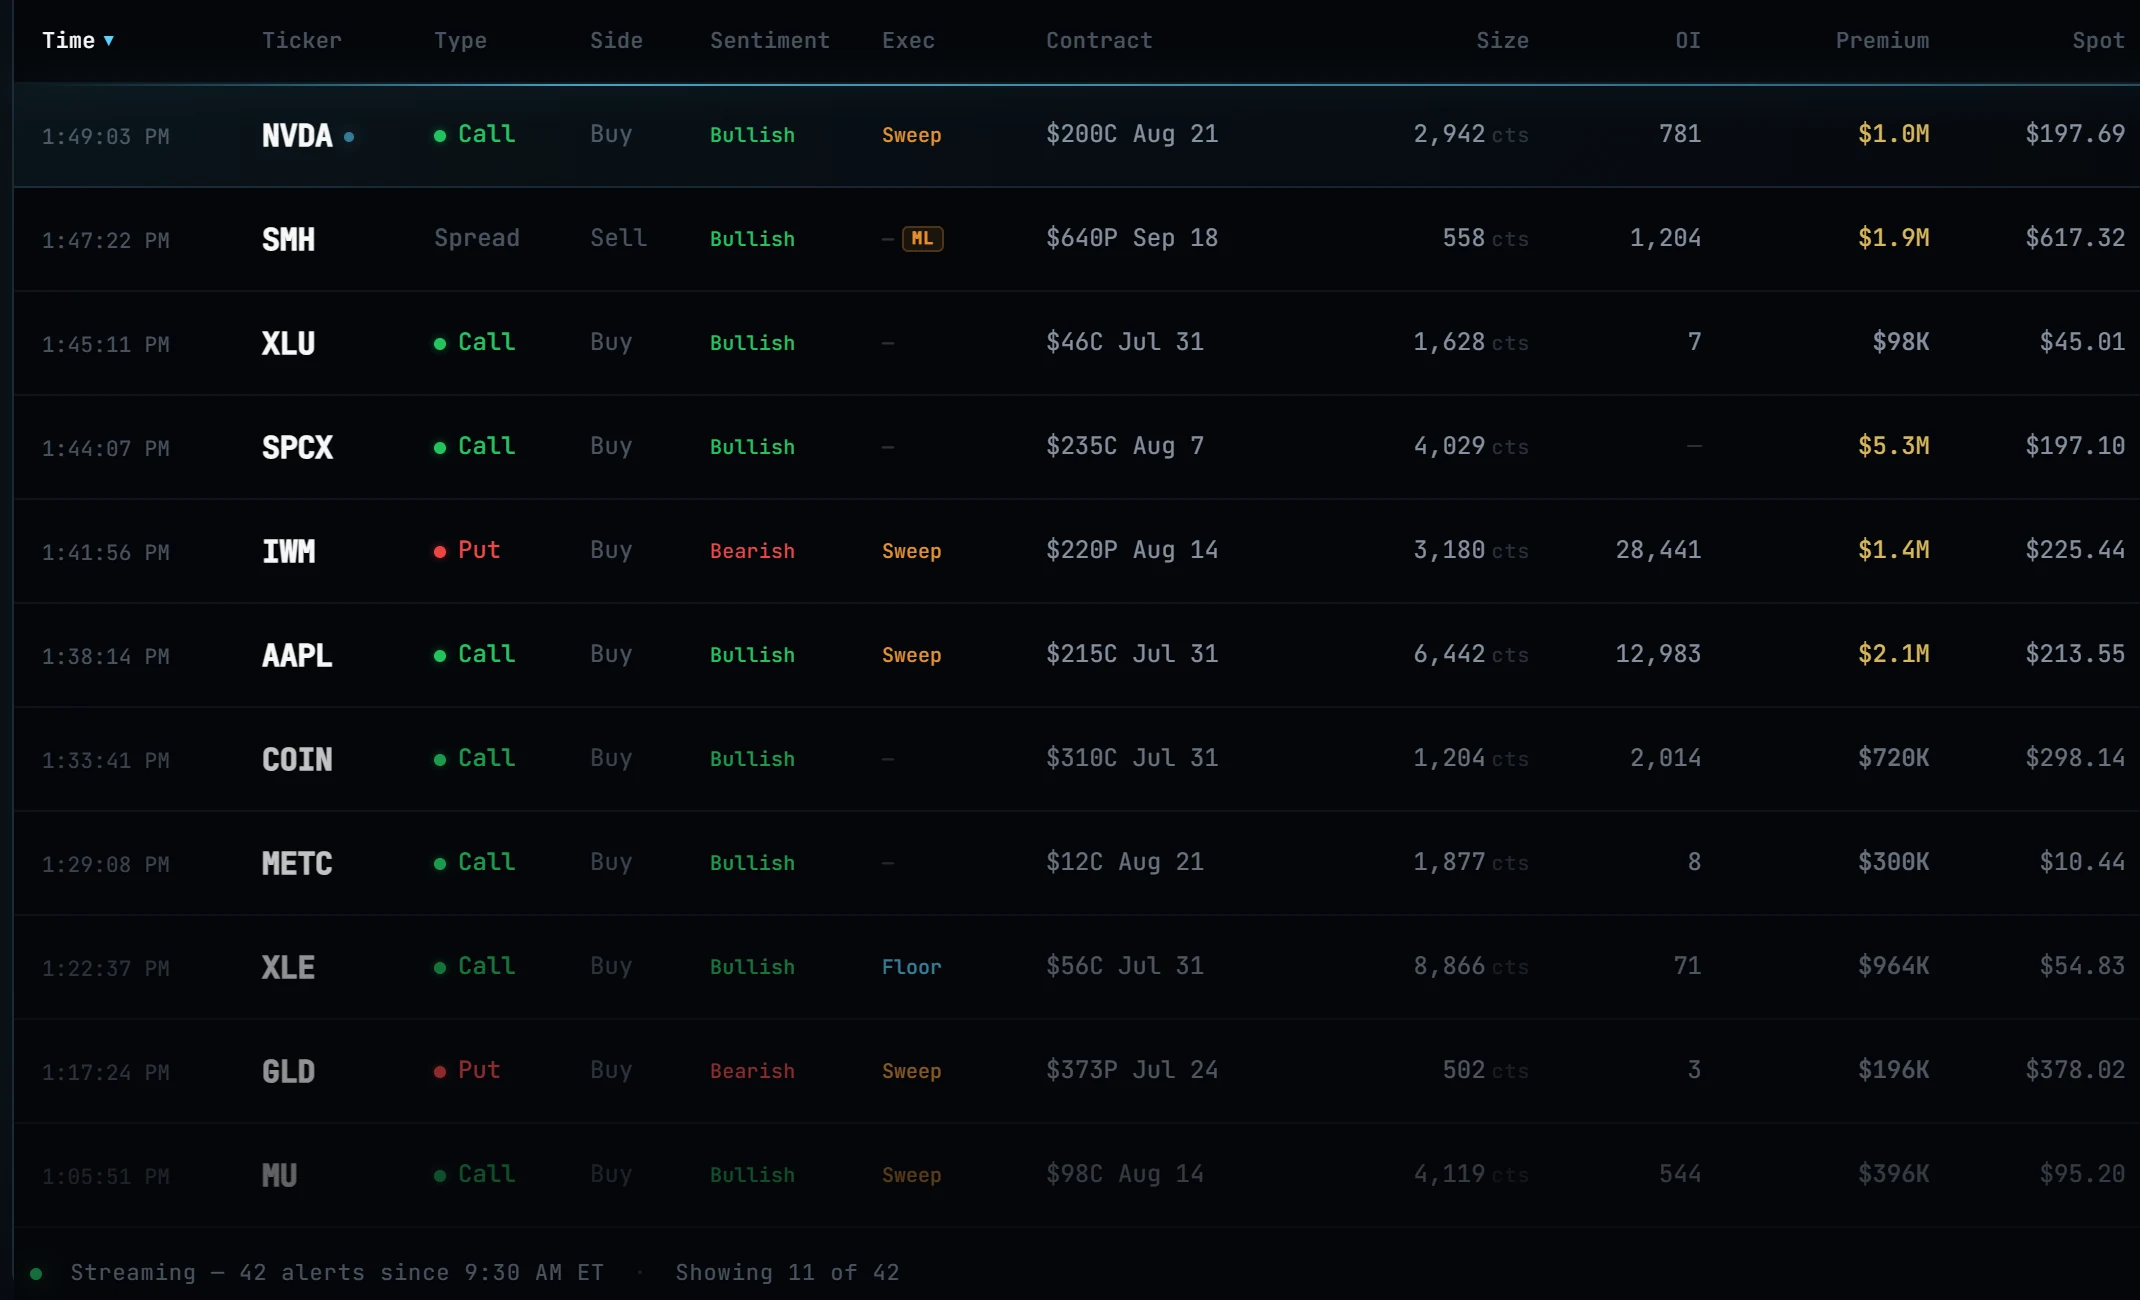
Sweeps versus blocks
A sweep is an order that takes displayed liquidity across multiple exchanges at once. Instead of resting on one venue and waiting for a fill, the order walks the book, grabbing whatever is offered at each price level until it is filled. On the tape this shows up as a burst of smaller prints across several exchanges within milliseconds, usually at or through the ask (for buys). The honest interpretation of a sweep is urgency of execution. Someone wanted the position now and was willing to pay spread to get it.
What a sweep does not prove is conviction or information. Execution algorithms slice large parent orders into sweep-shaped children as a matter of routine, and a market maker rebalancing a hedge can look identical to a fund lunging at a catalyst. Urgency is a real datapoint, but only one of several, and it says nothing about who is urgent or why.
A block is a large trade that prints in one piece, often on a single exchange, and often negotiated between two parties before it ever hits the tape. Blocks are frequently facilitated by a dealer, priced somewhere inside the spread, and tied to a stock hedge or to other option legs. Because the price was agreed upon rather than lifted from the book, the usual bid/ask inference gets weaker: a block printing near the midpoint tells you very little about which side initiated.
A useful shorthand: sweeps describe how a trade was executed, blocks show that size changed hands; neither explains why the trade was made, which is the question the rest of the read has to answer.
Volume versus open interest
Volume is how many contracts traded today. Open interest is how many contracts exist, meaning positions that were opened and never closed or exercised. Volume resets every session. Open interest updates once, overnight, after the OCC reconciles the day's trades. That next-morning update, not the intraday tape, is the closest thing flow reading has to a fact-check.
The comparison you run on every interesting print: today's volume in the contract against the open interest coming into the day. If 4,000 contracts trade against 900 open interest, then at least 3,100 of those contracts opened new positions at some point during the session, since a position that does not exist cannot be closed. One caveat keeps this from being airtight: a position opened and closed within the same day satisfies that arithmetic while leaving the next morning's open interest almost unchanged, so the volume excess proves opening happened during the day, not that anyone held the position overnight.
The reverse case needs more care. Heavy volume in a contract that already carries large open interest is ambiguous: it could be new opening interest, or holders closing out, or positions rolling to another strike or month. The tiebreaker arrives the next morning. Open interest up roughly by the traded size supports the opening read. Open interest flat or down usually points to closing, same-day round trips, or opening that was offset by unrelated closing elsewhere in the contract, and whatever story you built on the volume should be marked down accordingly.
Traders who check the next day's open interest on their reads are rarer than they should be, and it is the single cheapest habit that separates careful flow reading from pattern-matching on green numbers.
Inferring the aggressor side
The tape does not label buyers and sellers. Every trade has both. What you are actually inferring is the aggressor: which side crossed the spread to make the trade happen. The standard method compares the fill price to the quote at the moment of execution. A fill at or above the ask suggests the buyer initiated. A fill at or below the bid suggests the seller initiated. A fill near the midpoint is genuinely ambiguous, and much institutional volume prints at or near the midpoint.
This inference is probabilistic, and it degrades in predictable places. Quotes move fast around news, so the recorded quote may already be stale when the print lands. Price improvement and auction mechanisms fill orders inside the spread by design. Negotiated crosses can print anywhere the parties agreed. Any single print's side-tag deserves modest confidence at best.
Even a correct aggressor read only tells you which way the trade went; the position behind it can point the other way. A call bought at the ask might be a bullish opener. It might also be someone closing a short call, hedging short stock, or building the long leg of a spread whose other leg you have not spotted. Aggressor side answers one narrow question, who paid for immediacy, and the rest of the read has to come from context: opening versus closing (open interest), structure (other legs), and placement (strike and expiry).
What strike and expiry selection tell you
Where a trader puts size on the chain is often more informative than the size itself, because strike and expiry choices reveal what the trader is paying for.
- Short-dated, well out-of-the-money: a bet on a fast, sharp move, usually tied to a specific near-term catalyst. The contracts are cheap, the odds of a payoff are low, and the leverage is large when the move actually arrives. This is also the profile of most retail lottery flow, so size and context have to do the sorting.
- Near-the-money, four to eight weeks out: the classic directional-conviction profile. Enough time for a thesis to play out, enough delta that the position moves with the stock, expensive enough that casual money mostly stays away.
- Deep in-the-money, far-dated: often stock replacement. High delta, low extrinsic value, behaves like shares with less capital tied up. Directional, but rarely urgent.
- Expiry bracketing a known event: when the chosen expiry is the first one that captures an earnings date, a product announcement, or a macro release, the trader is telling you which catalyst they care about. When it is the last expiry before the event, they are telling you they expect resolution early, or they are selling the event premium.
Strikes clustering at round numbers or at obvious technical levels are worth noting too, though the interpretation is contested: some of that clustering is informed positioning around levels, and plenty of it is simply that humans and algorithms both like round numbers. Strike placement is a starting hypothesis; confirmation has to come from open interest and the structure check.
The multi-leg trap: where single-leg reading goes wrong
This is the failure mode that burns intermediate flow readers, the ones who have learned everything above and trust it too much. A large fraction of institutional options volume executes as multi-leg packages: vertical spreads, risk reversals, collars, calendars, and stock-tied combinations. The tape, however, reports legs. A collar on a large stock position, long puts plus short calls against shares, can appear on a naive feed as two separate prints: a scary-looking put buy and an aggressive call sale, both apparently bearish, on a position that is actually neutralized protection on a long holding.
The mechanics make it worse. When a package executes, the legs are priced to satisfy the net price of the whole structure and need not individually respect each leg's bid and ask, even though exchange complex-order rules do impose some per-leg constraints. A leg can print through its own ask without any buyer having aggressed on that leg in isolation. Per-leg aggressor inference, the tool from two sections ago, is close to meaningless inside a package.
Practical defenses:
- Check for same-second prints in the same underlying at other strikes, expiries, or in the stock itself before reading any large print in isolation.
- Be most suspicious of exactly the prints that look most dramatic. Enormous single-leg premium is disproportionately likely to be one piece of a hedged structure.
- Prefer a feed that detects and displays packages as whole structures rather than loose legs. If your tool cannot tell you whether a put buy stood alone, it cannot tell you what the put buy meant.
A worked read, end to end
A hypothetical, with round numbers. Say a stock trades at $100 and the feed shows a sweep: 4,000 of the $110 calls expiring in five weeks, filled across four exchanges at $1.55, against a quote of $1.45 bid, $1.55 ask. Total premium roughly $620,000. Day's volume in the contract is now 4,600 against open interest of 900. Earnings land in four weeks, inside this expiry.
Run the checks in order.
- Aggressor: filled at the full ask, swept across venues. High-confidence buyer-initiated, and executed with urgency.
- Opening or closing: volume of 4,600 against 900 open interest. At least 3,700 contracts opened new positions at some point today. Tomorrow's open interest will show how much of that was held overnight.
- Placement: 10% out-of-the-money, five weeks out, first expiry that captures earnings. The trader is paying for the event, with enough cushion after it for follow-through.
- Structure check: scan for same-second prints. Suppose there is no matching put print, no stock cross, nothing at other strikes. The single-leg reading survives, provisionally.
- Size in context: $620k of premium in a name where a typical day sees a few hundred contracts per strike is a loud outlier. The same premium in a mega-cap would be furniture.
The defensible conclusion: someone opened a substantial upside position into earnings, urgently, and probably unhedged on this chain. What you still do not know is who made the trade and whether it is offset by something you cannot see, such as a stock position or an over-the-counter hedge. A good flow read ends there, with a calibrated hypothesis and a plan to check tomorrow's open interest.
Common beginner mistakes
Most of the money lost trading flow is lost the same few ways.
- Reading every big call buy as bullish. Without an opening-versus-closing check and a package check, a big call buy is an unlabeled event.
- Skipping the next-day open interest check. It is the only confirmation the market gives you for free, and most people never look.
- Copy-trading the print. You get a later entry at a worse price, and you have no access to the original trader's exit plan or hedges. Even a genuinely informed trade can lose money for the person who tailgates it.
- Assuming institutional means informed. Much of the largest flow is hedging, rebalancing, and structured-product plumbing. Use size to prioritize which prints to check, then run the opening and package checks before drawing any conclusion.
- Trusting highlight reels. Any feed can screenshot winners. The only honest way to evaluate flow signals, ours included, is a track record that scores every signal against a fixed yardstick and includes the losers, with peak gains labeled as peaks rather than returns.
That last point is the standard we hold Nightglass to. Every signal we publish is scored, winners and losers alike, and the full track record is public at /performance if you want to judge the approach on evidence rather than examples.
Questions traders ask
Does a big call sweep mean someone knows something?
Sometimes, and you can rarely tell which time. A sweep proves the buyer wanted immediate execution and paid spread to get it. It does not distinguish an informed fund from an execution algorithm slicing a routine order or a dealer adjusting a hedge. Treat sweeps as an urgency flag that raises a print's priority for further checks, not as evidence on its own.
Can I just copy the biggest trades on the feed?
It tends to end badly. You enter after the price impact, without the original trader's hedges, cost basis, exit plan, or information. Large trades are also disproportionately likely to be one leg of a package or a hedge on a stock position, in which case there is no directional bet to copy in the first place. Use flow as context for trades you already have an independent reason to make.
Why does open interest matter if I can watch volume live?
Volume tells you contracts traded but not whether positions were opened or closed. Open interest, which updates overnight, settles that question. When today's volume exceeds existing open interest, some opening during the day is guaranteed; in every other case, the next morning's open interest change is the confirmation, and it costs nothing to look up.
How can a huge put purchase be bullish, or at least not bearish?
Puts are the standard insurance instrument. A fund holding a large stock position buys puts to protect it, and that print looks identical to a bearish bet unless you spot the tied stock trade or offsetting call leg. Puts are also sold to open, bought to close shorts, and traded inside spreads. Work through those alternatives before you read a put print as bearish.
What premium size is actually worth paying attention to?
It depends on the underlying more than on any fixed number. Six figures of premium in a quiet mid-cap is a genuine outlier; the same premium in a mega-cap or an index product is routine. The useful comparison is size against what normally trades in that name and that contract, and the useful caveat is that the largest premium tiers are the most likely to be hedged or part of a multi-leg structure.
Everything Nightglass surfaces is scored on a public track record — winners and losers, methodology included. See the tape →