GEX is a different lens than order flow
Gamma exposure, usually shortened to GEX, is an estimate of how much stock options dealers need to buy or sell to stay hedged as the underlying price moves. It is not flow data and it is not a sentiment gauge. Flow analysis tries to work out what large traders are positioning for; GEX describes how the market's hedging machinery will respond once price actually starts moving, whoever turns out to be right about direction.
The reason it matters is scale. Market makers sit on the other side of a huge share of listed options volume, and they hedge that book mechanically rather than on opinion. Depending on how the book is positioned, all of that hedging either leans against price movement, which keeps an index or a stock stuck in a tight, choppy range, or leans with it, which stretches ordinary moves into outsized ones. Knowing which environment you are in changes how you read everything else on the tape, including the flow itself.
Delta first, then gamma
Two Greeks are enough to get there. Delta measures how much an option's price moves per one-dollar move in the stock. A call with a 0.50 delta gains roughly fifty cents when the stock rises a dollar. Deep in-the-money options carry deltas near 1.0 and trade almost like stock; far out-of-the-money options carry deltas near zero.
Gamma is the rate at which delta changes as the stock moves. A high-gamma option's delta swings quickly, so a small move in the underlying produces a large change in how much stock-like exposure the option represents. Gamma is highest for options near the money and close to expiration, which is why hedging pressure clusters around at-the-money strikes in the front expirations, and why 0DTE contracts and the week around monthly expiration produce the most intense hedging dynamics.
That is the entire Greek prerequisite. You do not need to price anything; the point is simply that a dealer's hedge cannot sit still while the stock moves.
Why market makers hedge, and why it moves the market
When you buy a call, a market maker is usually the seller. They have no view on the stock; their business is earning the bid-ask spread while staying flat. Being short your call is directional risk they do not want, so they neutralize it by buying stock in proportion to the option's delta.
A deliberately simple, hypothetical example with round numbers. A stock trades at $100 and a dealer sells 1,000 calls at the $100 strike with a 0.50 delta. Each contract covers 100 shares, so the dealer buys 50,000 shares to start flat. The stock rallies to $102 and the call's delta rises to 0.60, so the dealer now needs 60,000 shares and buys 10,000 more into the rally. If the stock instead drops to $98 and delta falls to 0.40, the dealer sells down to 40,000 shares, adding supply into the decline. The rebalancing never stops, because delta never stops changing.
One dealer adjusting one strike is negligible, but the same arithmetic runs continuously across thousands of strikes and billions of dollars of open interest, and at that scale the hedging itself becomes a force that moves the underlying market. GEX models attempt to add it all up into a single estimate: the aggregate stock dealers must trade per unit of market movement, and in which direction.
Positive gamma: hedging that leans against the move
When dealers are net long gamma, which is common when customers have sold a lot of premium or when large open interest sits near the current price, their hedge adjustments run opposite to the market:
- Stock rises: dealer deltas get longer than target, so they sell stock into the rally.
- Stock falls: deltas shrink below target, so they buy stock into the dip.
The net effect is dampening. Rallies meet mechanical supply, selloffs meet mechanical demand, and realized volatility compresses. A heavy positive-gamma tape feels like a market wearing a weighted vest: breakouts stall, intraday ranges shrink, and price tends to grind toward the strikes carrying the largest open interest rather than trend away from them. Index markets spend a good share of ordinary, low-news weeks in this state, which is part of why so many intraday breakout trades die quietly.
Negative gamma: hedging that chases the move
Flip the book and the machine reverses. When dealers are net short gamma, typically after heavy put buying has left them short downside options, their hedge adjustments run in the same direction as the market:
- Stock falls: the puts dealers are short gain delta, so dealers must sell stock to stay hedged, adding supply into a falling market.
- Stock rises: those short-option deltas bleed off, so dealers buy stock back, adding demand into a rising market.
Hedging now amplifies whatever the market was already doing. Declines gain speed because each leg lower forces more dealer selling, which produces the next leg lower. This mechanical loop is a large part of why markets sometimes fall far more than the day's catalyst seems to justify. The same dynamic works on the upside too; rallies in a negative-gamma tape can rip with the same lack of friction.
| Regime | Dealer hedging | Typical tape |
|---|---|---|
| Positive gamma | Sells rallies, buys dips | Range-bound, mean-reverting, pins near big strikes, breakouts fail |
| Negative gamma | Buys rallies, sells dips | Fast, trending, prone to cascades, breakouts extend |
The gamma flip, walls, and why levels act like magnets
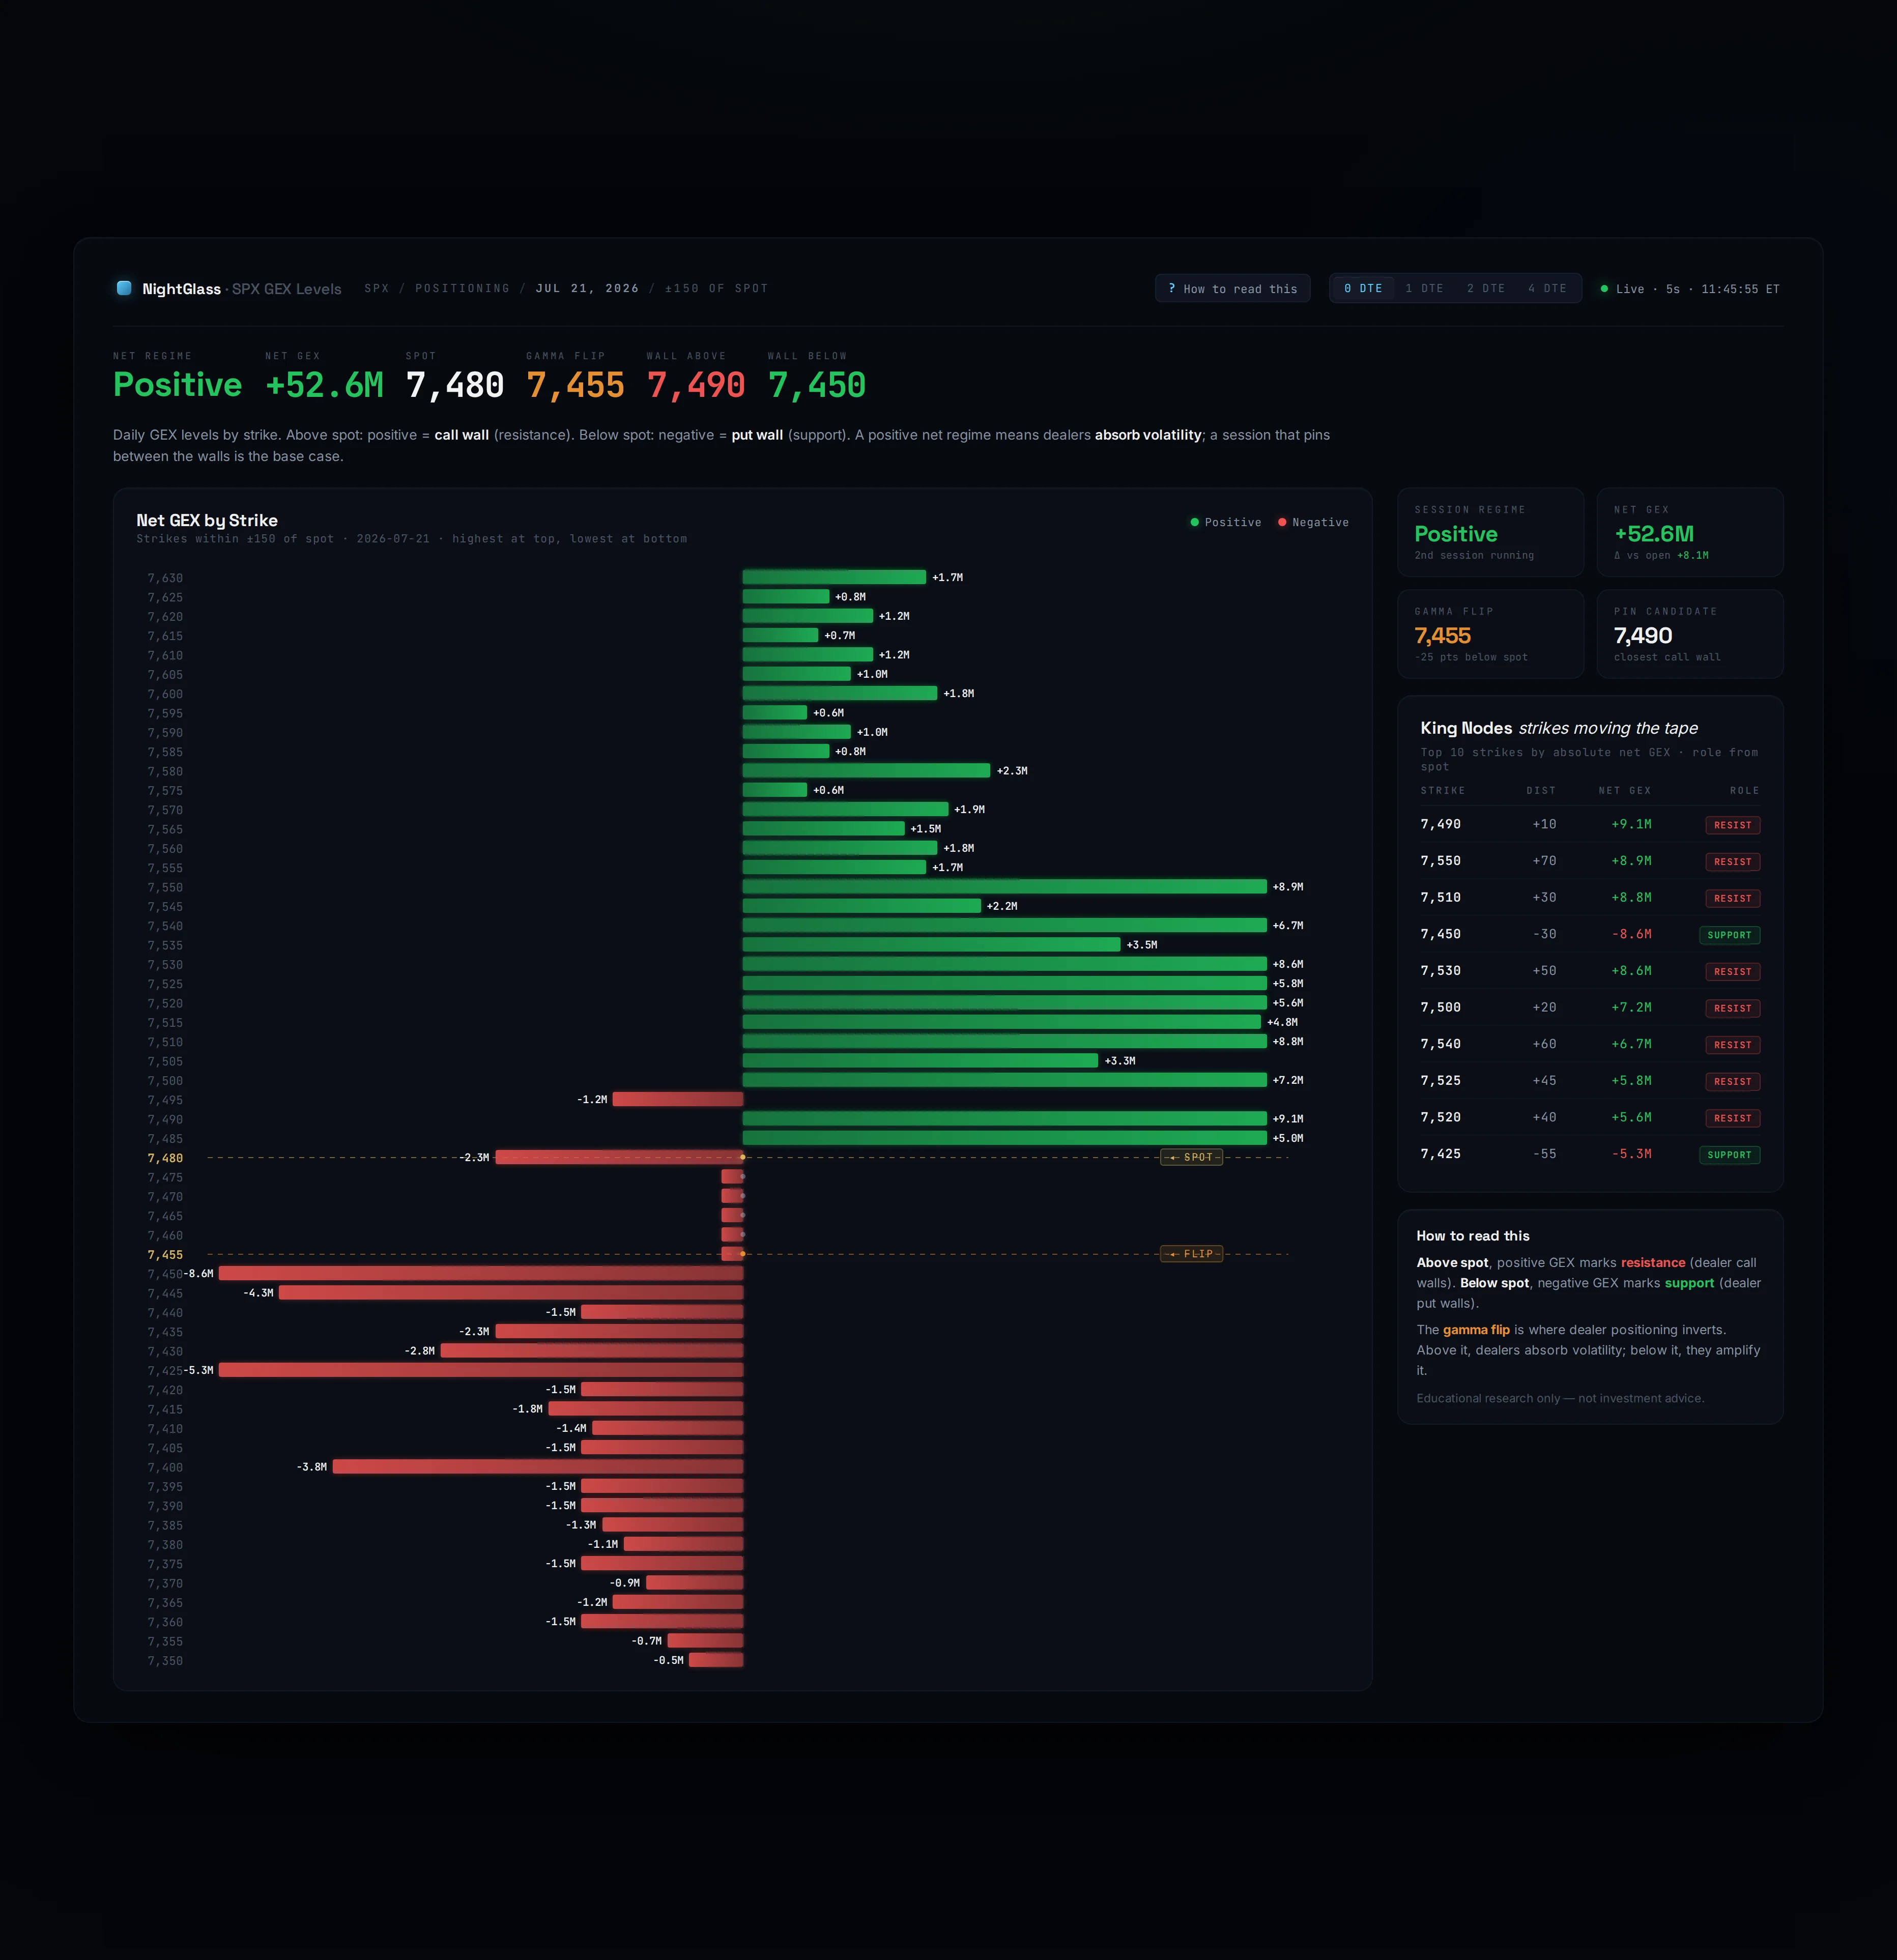
Because the dealer book mixes long and short options across every strike, its net gamma depends on where the underlying is trading. GEX models estimate the price at which the book crosses from net long to net short gamma, usually called the gamma flip. Above the flip the dampening regime applies, and below it the same open interest starts amplifying moves instead. It is one number worth knowing before the open, with the caveat that different models place it differently.
Models also map individual strikes. A strike carrying unusually large put open interest is often labeled a put wall: as price falls toward it, those puts gain delta and the dealers short them must buy stock, so demand materializes right where the market is weakest. A large call-OI strike works the same way from above, generating dealer supply as price rallies into it. Neither is a hard barrier. They are zones where mechanical flow makes continuation harder, and they can absorb a move without stopping it.
The magnet effect is the expiration version of the same mechanics. Near expiry, gamma at the biggest at-the-money strikes becomes extreme, and dealer rebalancing keeps pulling price back toward the strike whenever it drifts, which is why heavily traded names so often settle near a round, high-OI strike on expiration Friday. Once a level breaks in a negative-gamma tape, though, the math turns it into an accelerant, because the hedging that was absorbing the move starts feeding it.
All of these levels are rebuilt daily. Positions open, close, and expire every session, so yesterday's flip point or wall may simply not exist today.
Monthly expiration, honest limits, and pairing GEX with flow
The third Friday of each month is the most important recurring date on the GEX calendar. Into monthly expiration, enormous open interest has accumulated across strikes, gamma is high, and the pinning and vol-suppression effects are at their strongest. On expiration day that open interest vanishes, and the hedging pressure goes with it. The week after monthly OpEx frequently trades with a looser, trendier character because the mechanical dampening is gone. It is a real and recurring rhythm in index markets, though never a guarantee in any given month.
Three limits worth keeping in front of you:
- Every GEX figure is an estimate. Nobody outside the dealing community sees the actual book. Most public models assume customers are long the options and dealers are short, which is wrong for a meaningful slice of the market, and models disagree with each other for exactly this reason.
- GEX says nothing about direction. It describes whether the next move is likely to be absorbed or amplified and where mechanical supply and demand sit, not which way price goes.
- Levels expire. The whole gamma profile shifts as open interest changes, so stale levels are worse than no levels.
The practical use is as a companion to order flow. Flow gives you a read on what large traders are positioning for, and GEX tells you whether market structure will fight that positioning or accelerate it. A bullish flow read in a pinned, positive-gamma tape may need time and patience; the same read in a freshly unpinned tape after OpEx, or below the flip, has far more room to travel. Nightglass is built to put both lenses on one screen, and the waitlist on the home page is open if that fits your process.
Questions traders ask
Is high gamma exposure bullish or bearish?
Neither. GEX describes a volatility regime, not a direction. A strongly positive-gamma environment tends to produce compressed, mean-reverting ranges, while a negative-gamma environment tends to amplify moves in whichever direction the market is already going. Direction has to come from somewhere else, such as flow or your own thesis.
What is the gamma flip point?
It is the estimated underlying price at which the dealer book crosses from net long gamma to net short gamma. Above it, dealer hedging tends to dampen moves; below it, the same hedging tends to amplify them. Because it is modeled from open interest with assumptions about who holds what, different models place the flip at different levels.
Why do stocks pin to certain strikes on expiration day?
Gamma is at its most extreme for at-the-money options right before expiry. When a strike carries very large open interest, dealer rebalancing pushes against price every time it drifts away from that strike, which drags price back toward it. The result is the familiar pattern of active names settling near a big round strike on expiration Friday.
How accurate are GEX numbers?
Treat them as useful estimates, not ground truth. The actual dealer book is not public, so every model infers it from open interest, usually assuming dealers are short the options customers hold. That assumption fails for part of the market, and estimates shift every session as positions open, close, and expire. Check levels fresh each day and expect disagreement between sources.
What is the difference between GEX and options flow?
Flow analysis reads what large traders are doing: what they bought or sold, at which strikes, and with how much urgency. GEX estimates how the market's hedging machinery will react once price moves. Flow is about intent, GEX is about terrain, and the strongest setups are usually the ones where both point the same way.
Everything Nightglass surfaces is scored on a public track record — winners and losers, methodology included. See the tape →